Impactool
Feature Design / Discovery · UI/UX Designer — Feature & Discovery
Context
Built during the E+ Energy Transition Hackathon 2026, integrated with PID (Interactive Decarbonization Platform).
Challenge
Translate complex environmental impact data into a tool that works for both non-expert users and technical specialists — without losing accuracy or trust.
Process
- 01Discovery sessions and stakeholder alignment on PID requirements.
- 02User flows separating quick estimates from expert-level inputs.
- 03Wireframes and visual hierarchy tests for dual audiences.
- 04High-fidelity UI and handoff-ready screens for implementation.
Discovery & process
My role in the project
Product Designer & Video Editor
Hackathon E+ · 2026
- —Responsible for the design of an impact calculator integrated with the PID (Decarbonization Interactive Platform), which calculates the environmental, financial, and socio-political impacts of raw materials in the Brazilian energy matrix, using traceable data linked to official sources (IBGE, Gov.br).
- —Responsible for the discovery phase and low-fidelity wireframes (paper and digital desktop), applying the Double Diamond framework to structure the process. Defined the color system aligned with the PID style guide and the visual hierarchy of the web-like interface.
- —Designed the filter system by category (Environmental / Financial / Socio-Political) with a focus on clarity and low visual clutter, balancing the needs of lay users and experts based on User-Centered Design.
- —Bidirectional tool: users enter a raw material to visualize its impacts, or input a desired result to calculate the required input. This insight came directly from mapping the user journey of the Advocacy team.
Site flow
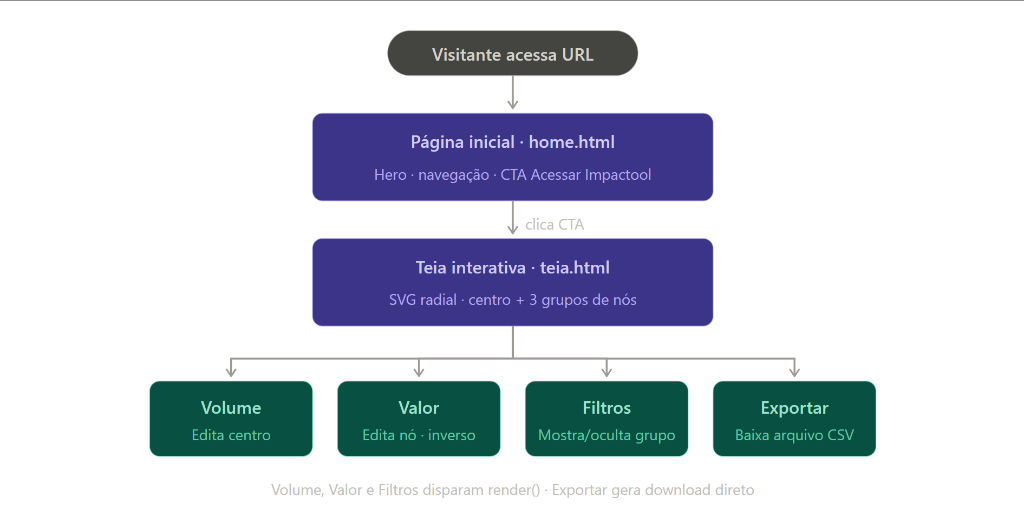
Mapping the user navigation flow (User Flow), starting from the initial access to the Landing Page, routing the CTA click to the interactive network page, and detailing the Volume, Value, Filters, and Export actions.
AI-generated logo
Development of the visual identity and branding for Impactool. The brand was conceived using modern references to green technology and sustainability, with geometric typography and a strong digital symbol representing decarbonization.
Low-fi wireframes — paper
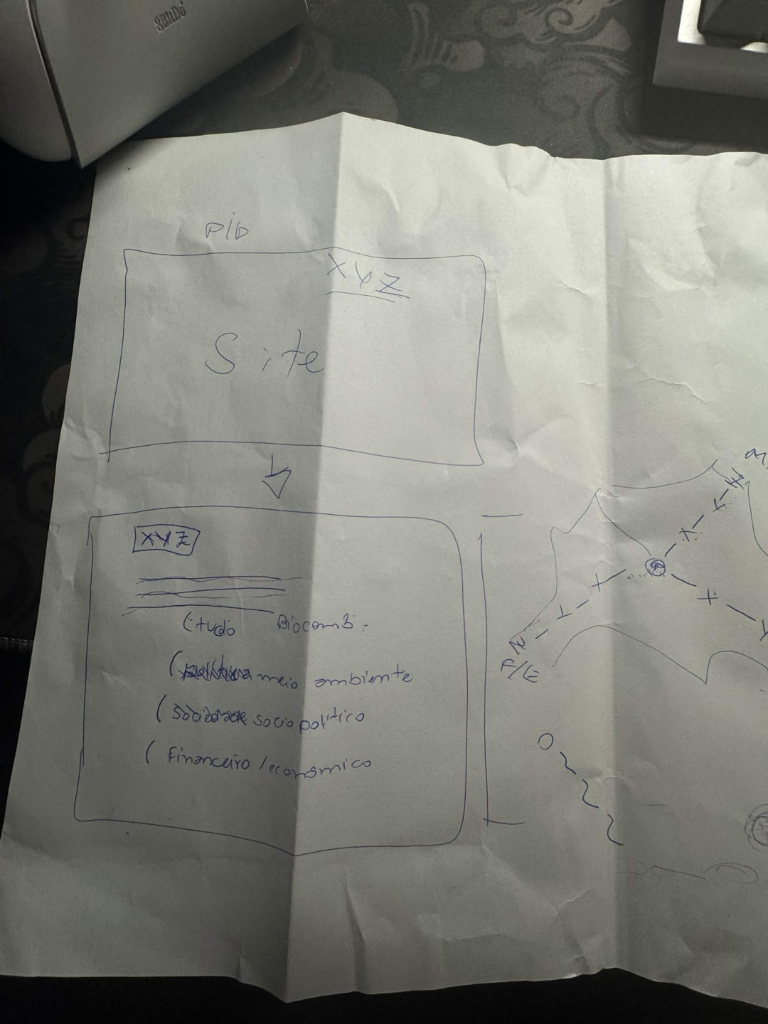
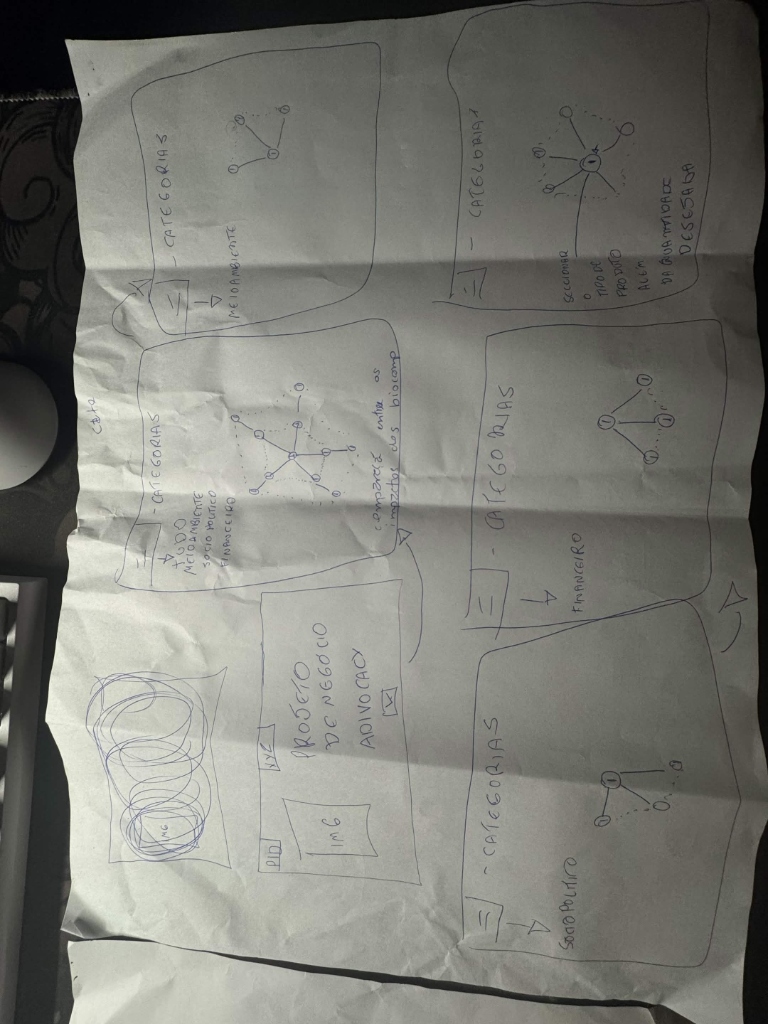
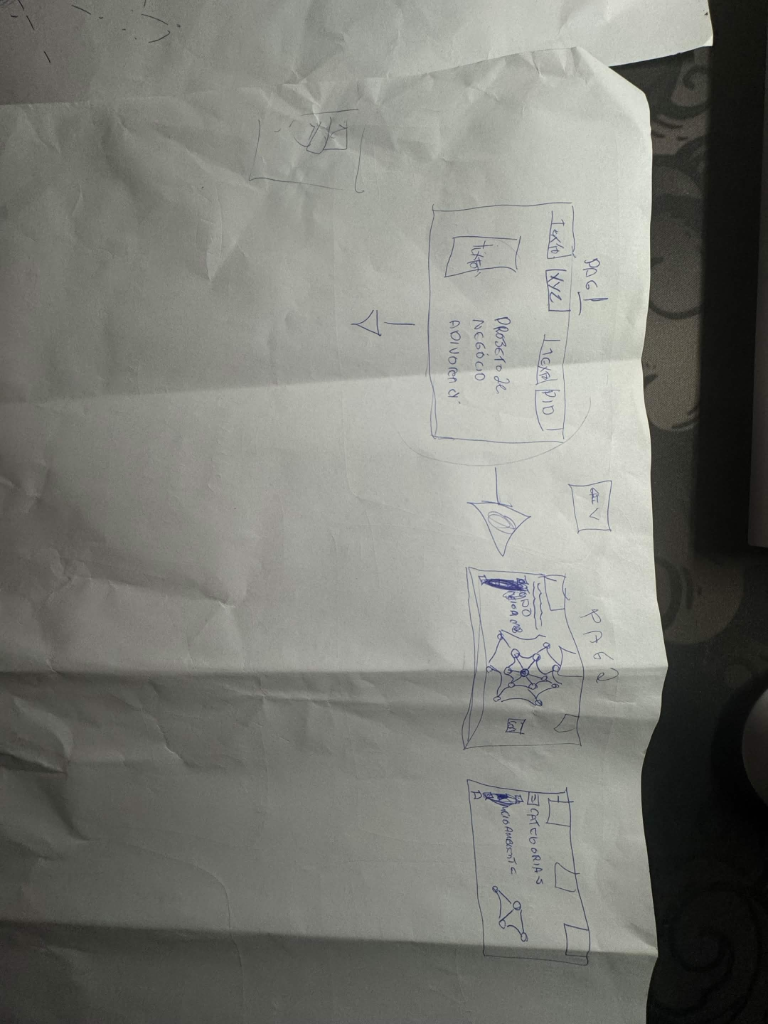
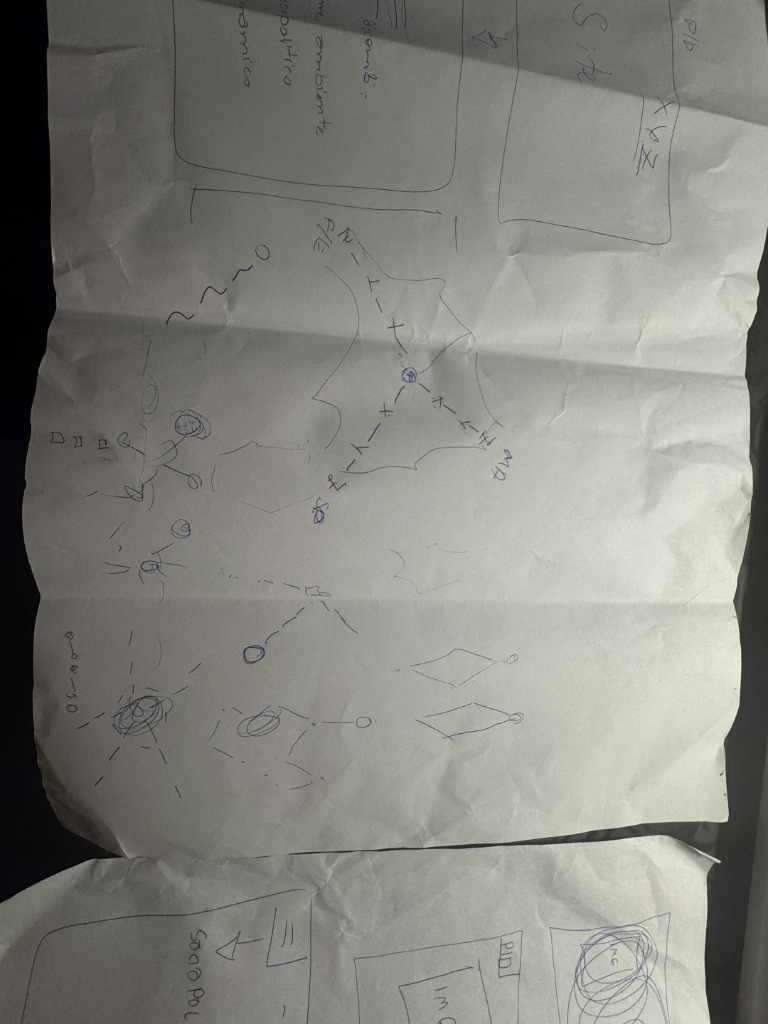
Initial sketches and low-fidelity paper wireframes. This step was crucial for quickly experimenting with different layout structures, organizing the first grids, and defining the distribution of the radial network nodes.
Low-fi wireframes — desktop
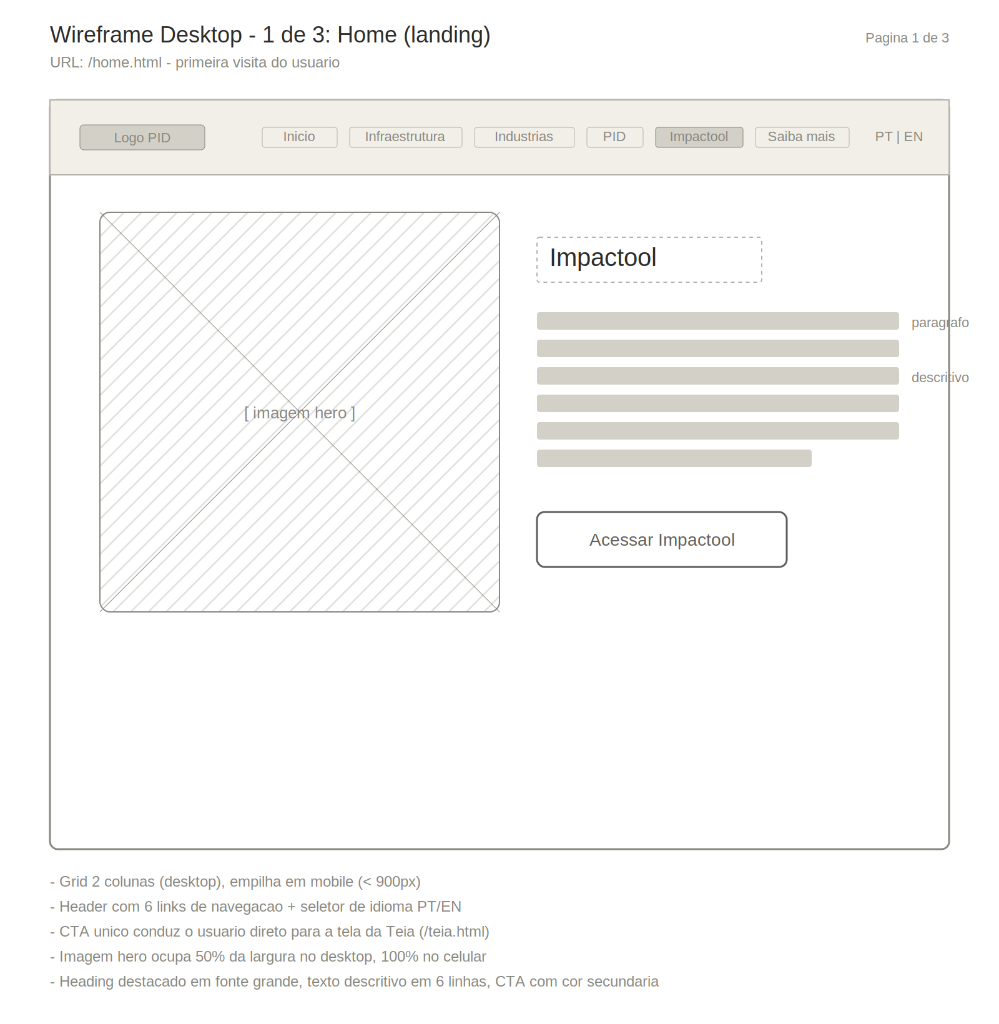
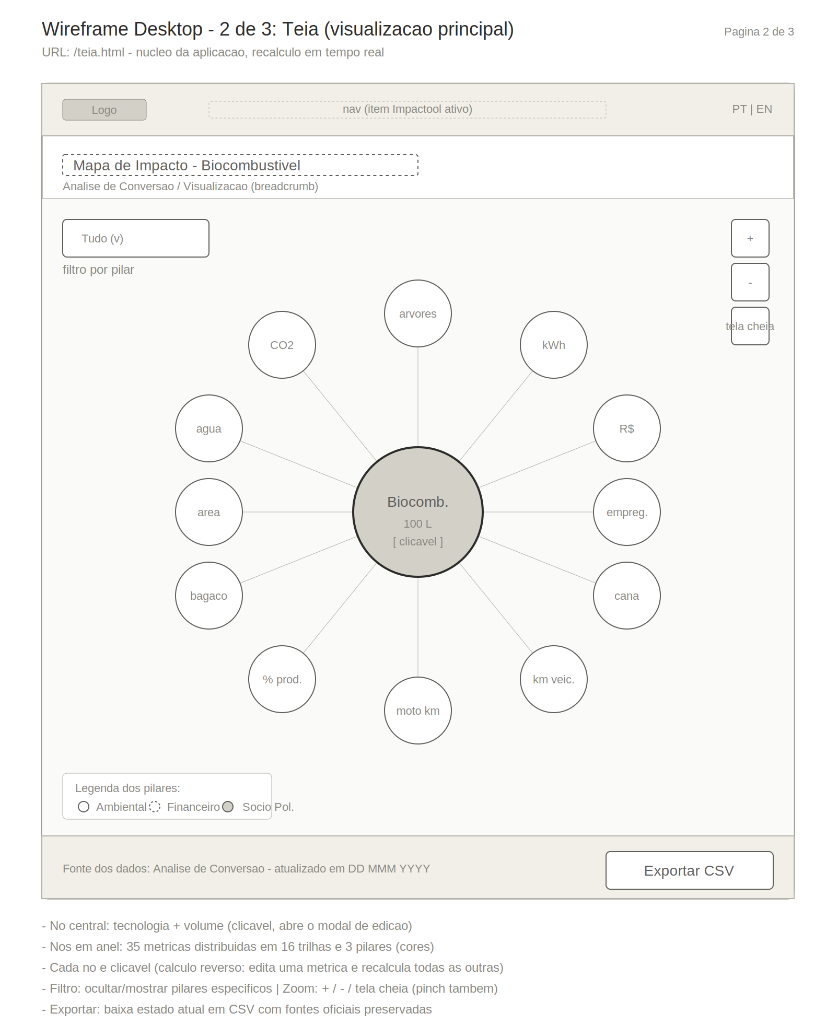
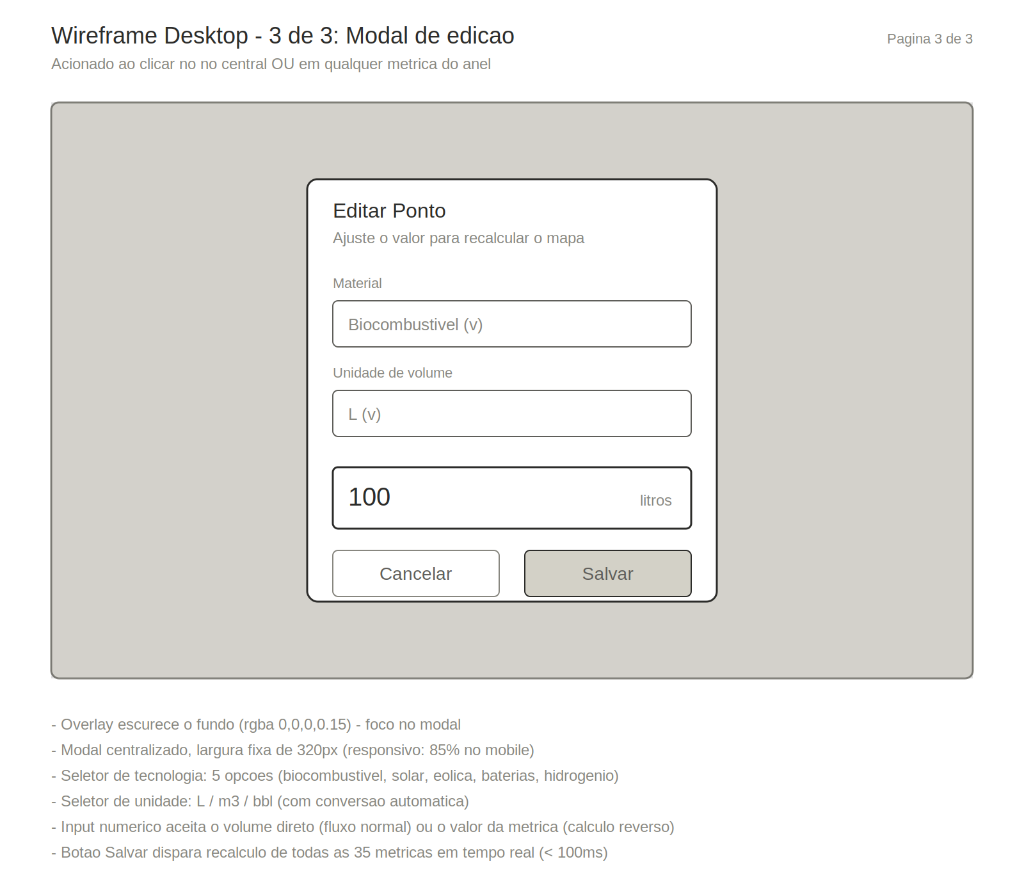
Translating the paper sketches into medium-fidelity digital wireframes (Desktop). We defined the two-column structure of the Landing Page, the positioning of zoom controls, full screen, filter selector, and the detailed edit modal.
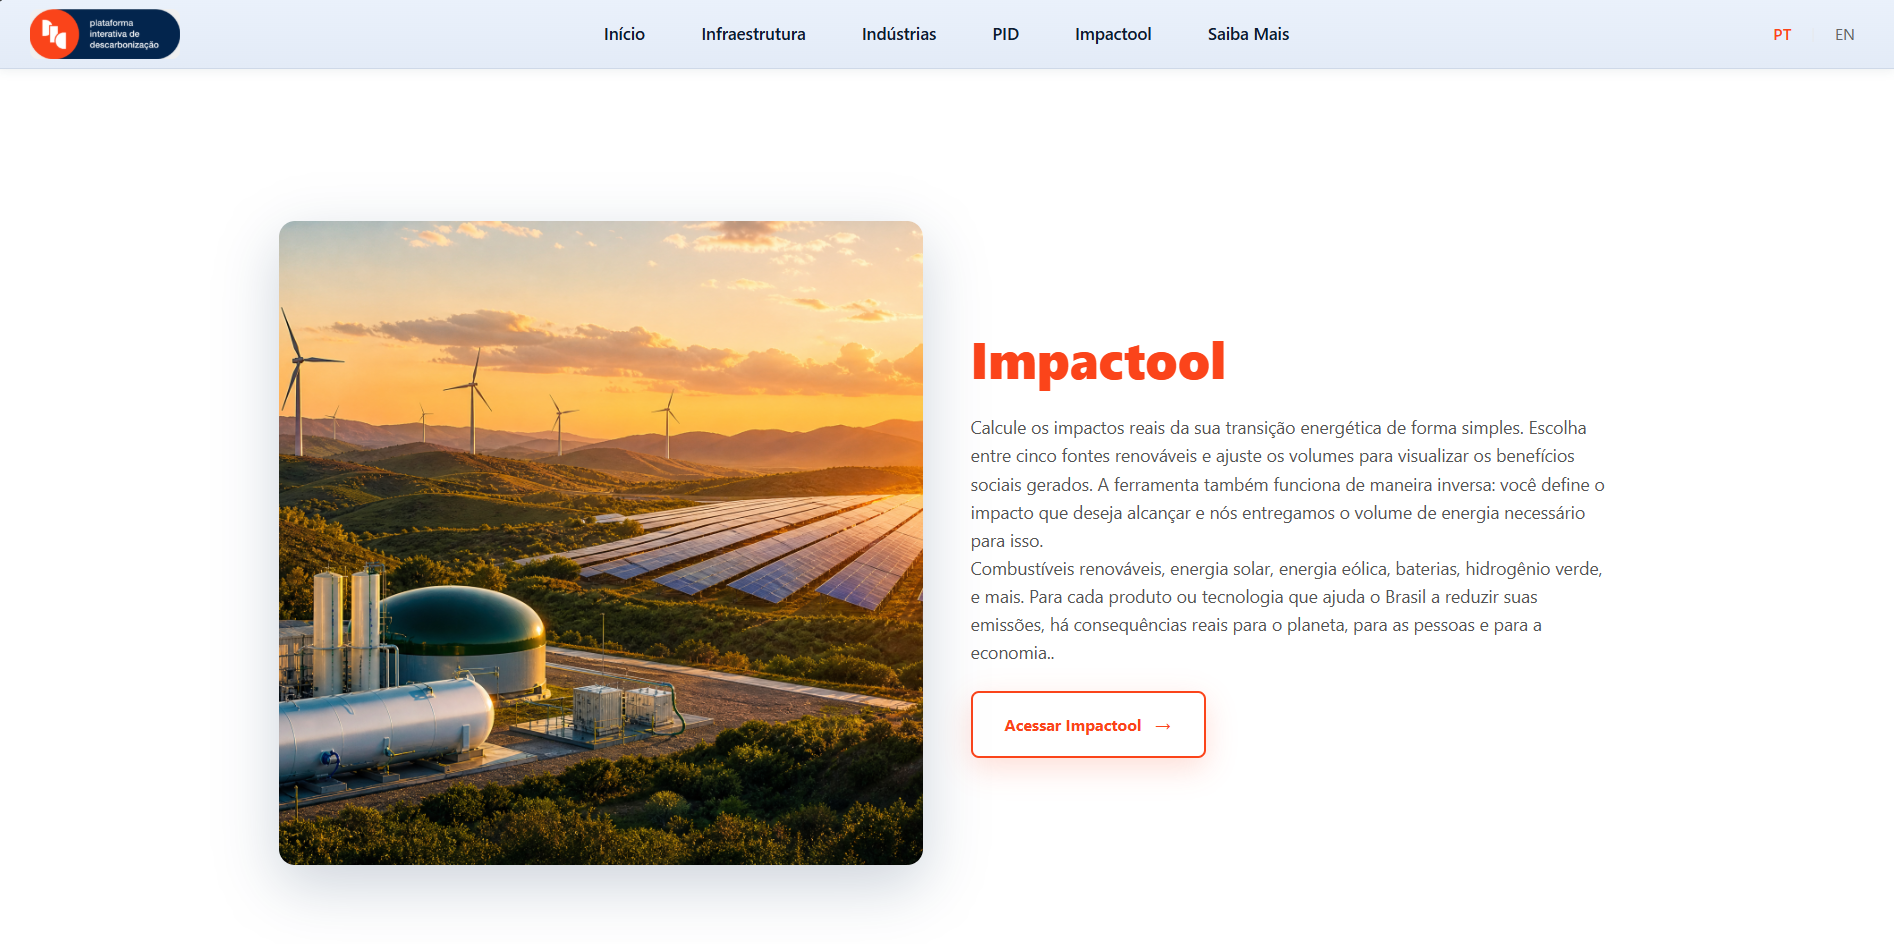
High-fidelity prototype screens

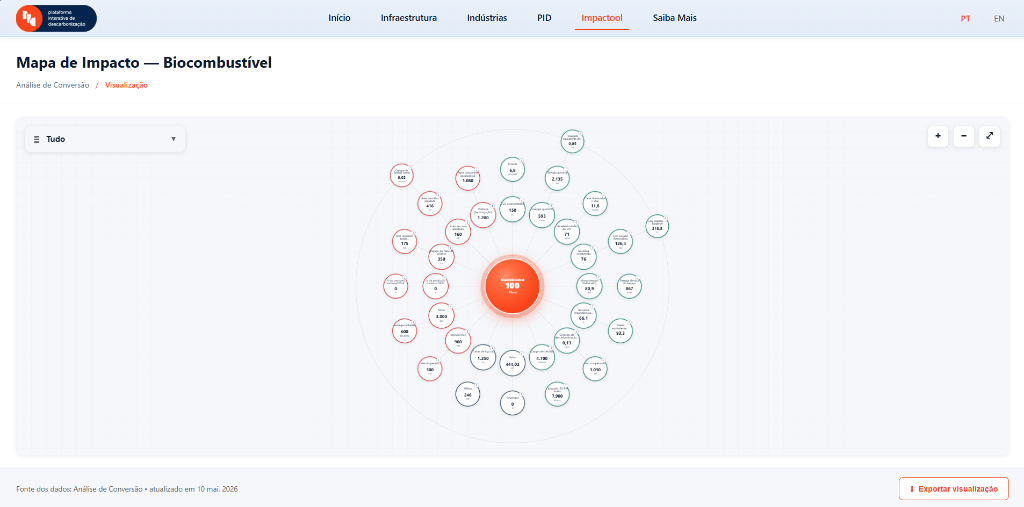
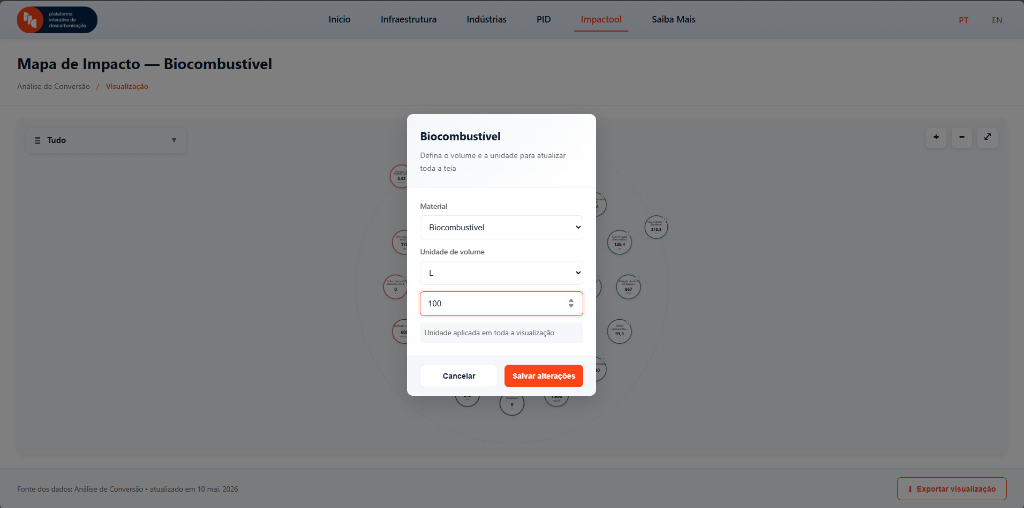
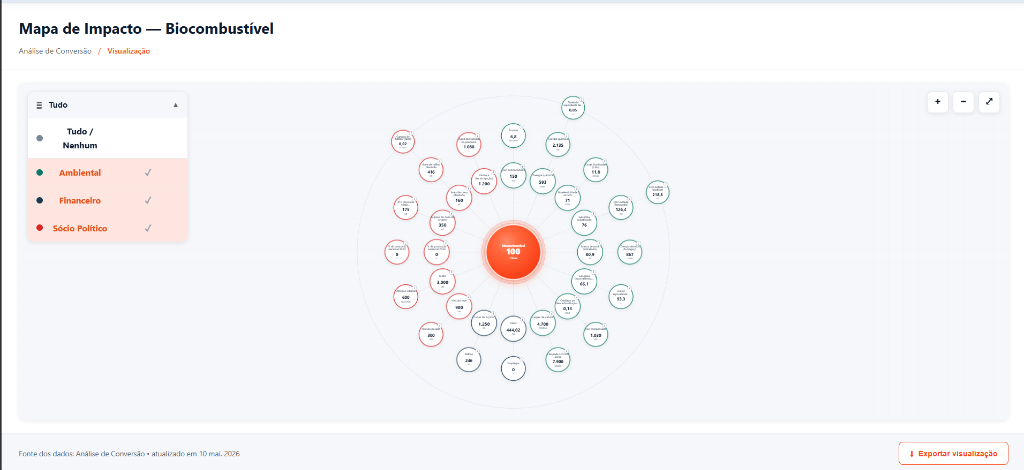
Final high-fidelity prototype screens. Application of the complete design system with contrasting clean-energy inspired colors (orange and dark blue), Barlow and Bebas Neue typography, dynamic hover effects, and a realistic simulation of the emissions calculator.
Deliverables
- — Discovery documentation
- — User flows & wireframes
- — Visual UI system for the calculator
- — Hackathon pitch-ready prototype
Outcome
2nd place at Hackathon E+ 2026. The feature made impact estimation accessible while keeping depth for expert users.